
Analysis and opinion · City Hall
Downtown has Vancouver’s biggest total tax bill. The typical notice tells another story.
The West End generates 3.7 times as much in tax bills per hectare as Shaughnessy. We think Vancouver’s apartment neighbourhoods deserve more credit.
Share this article
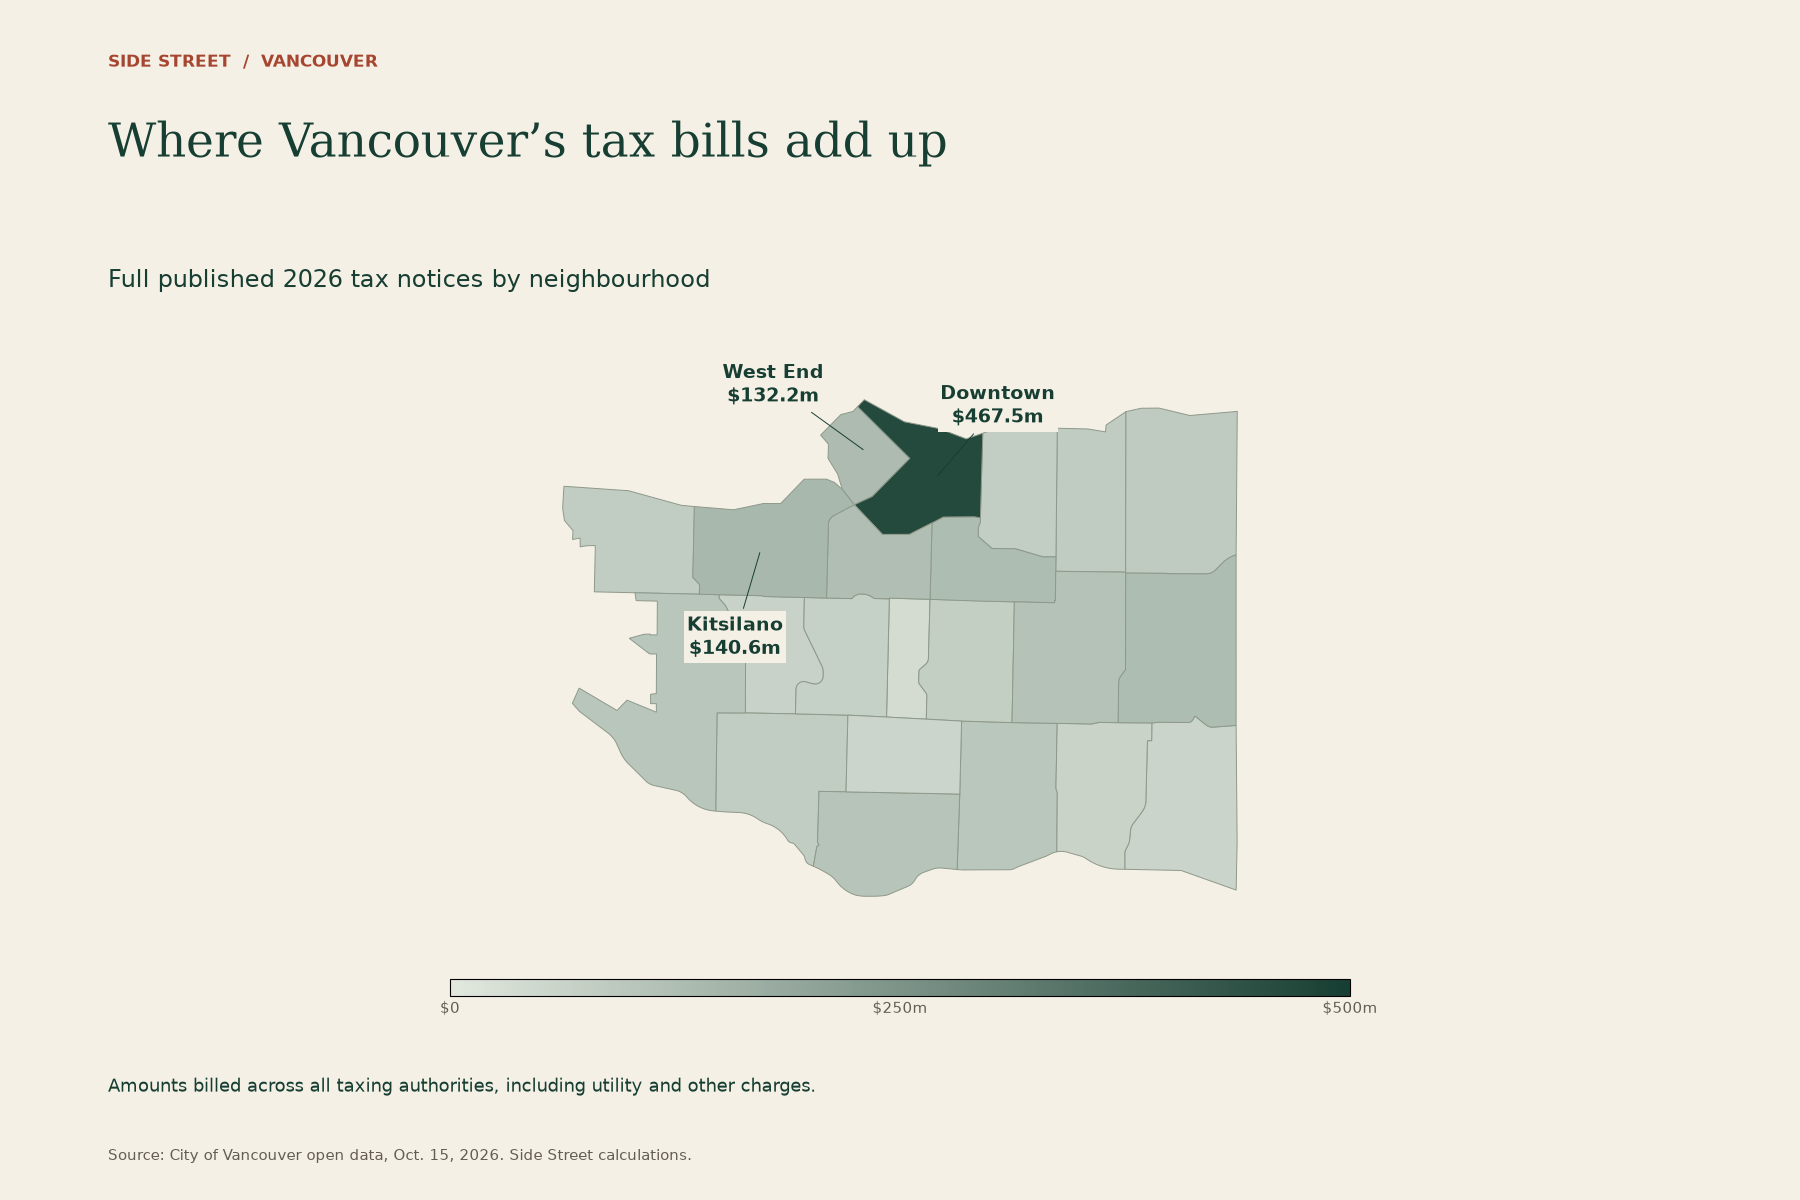
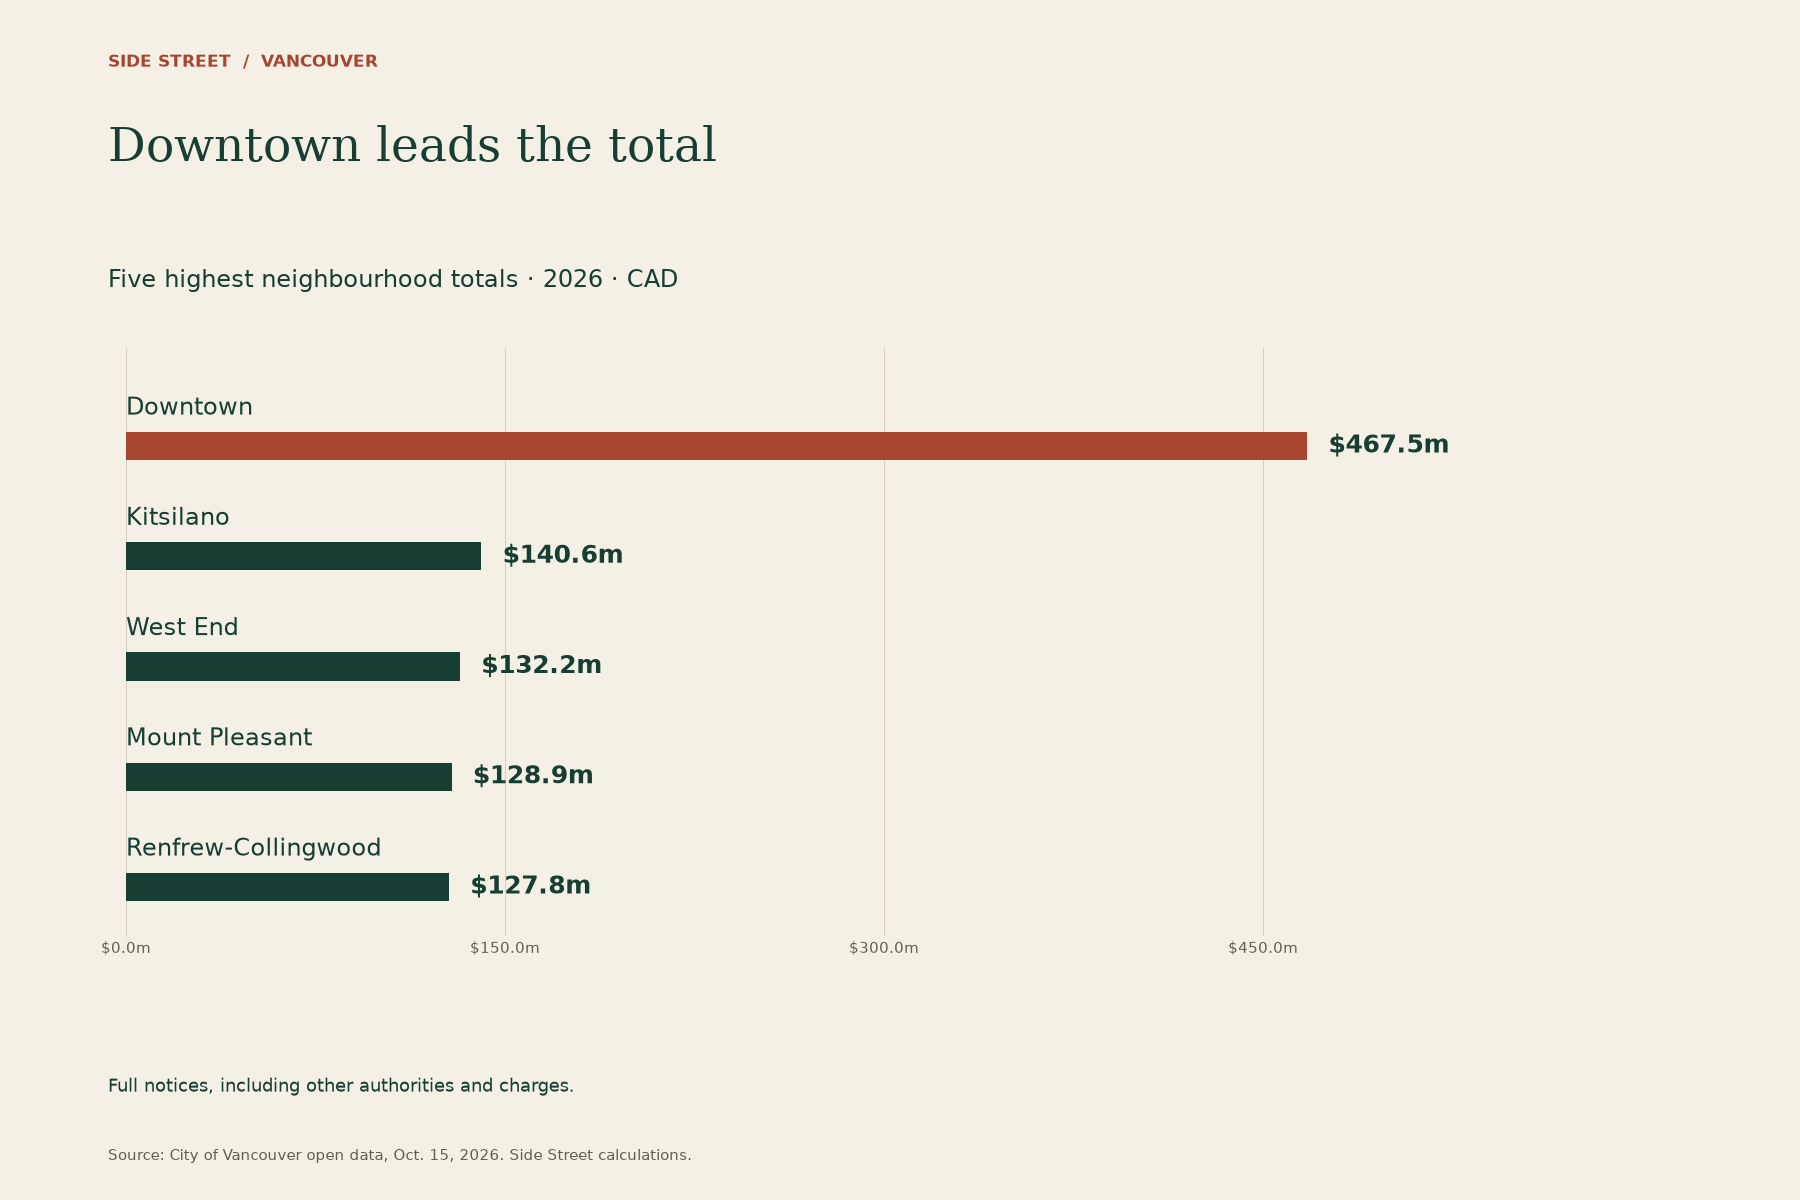
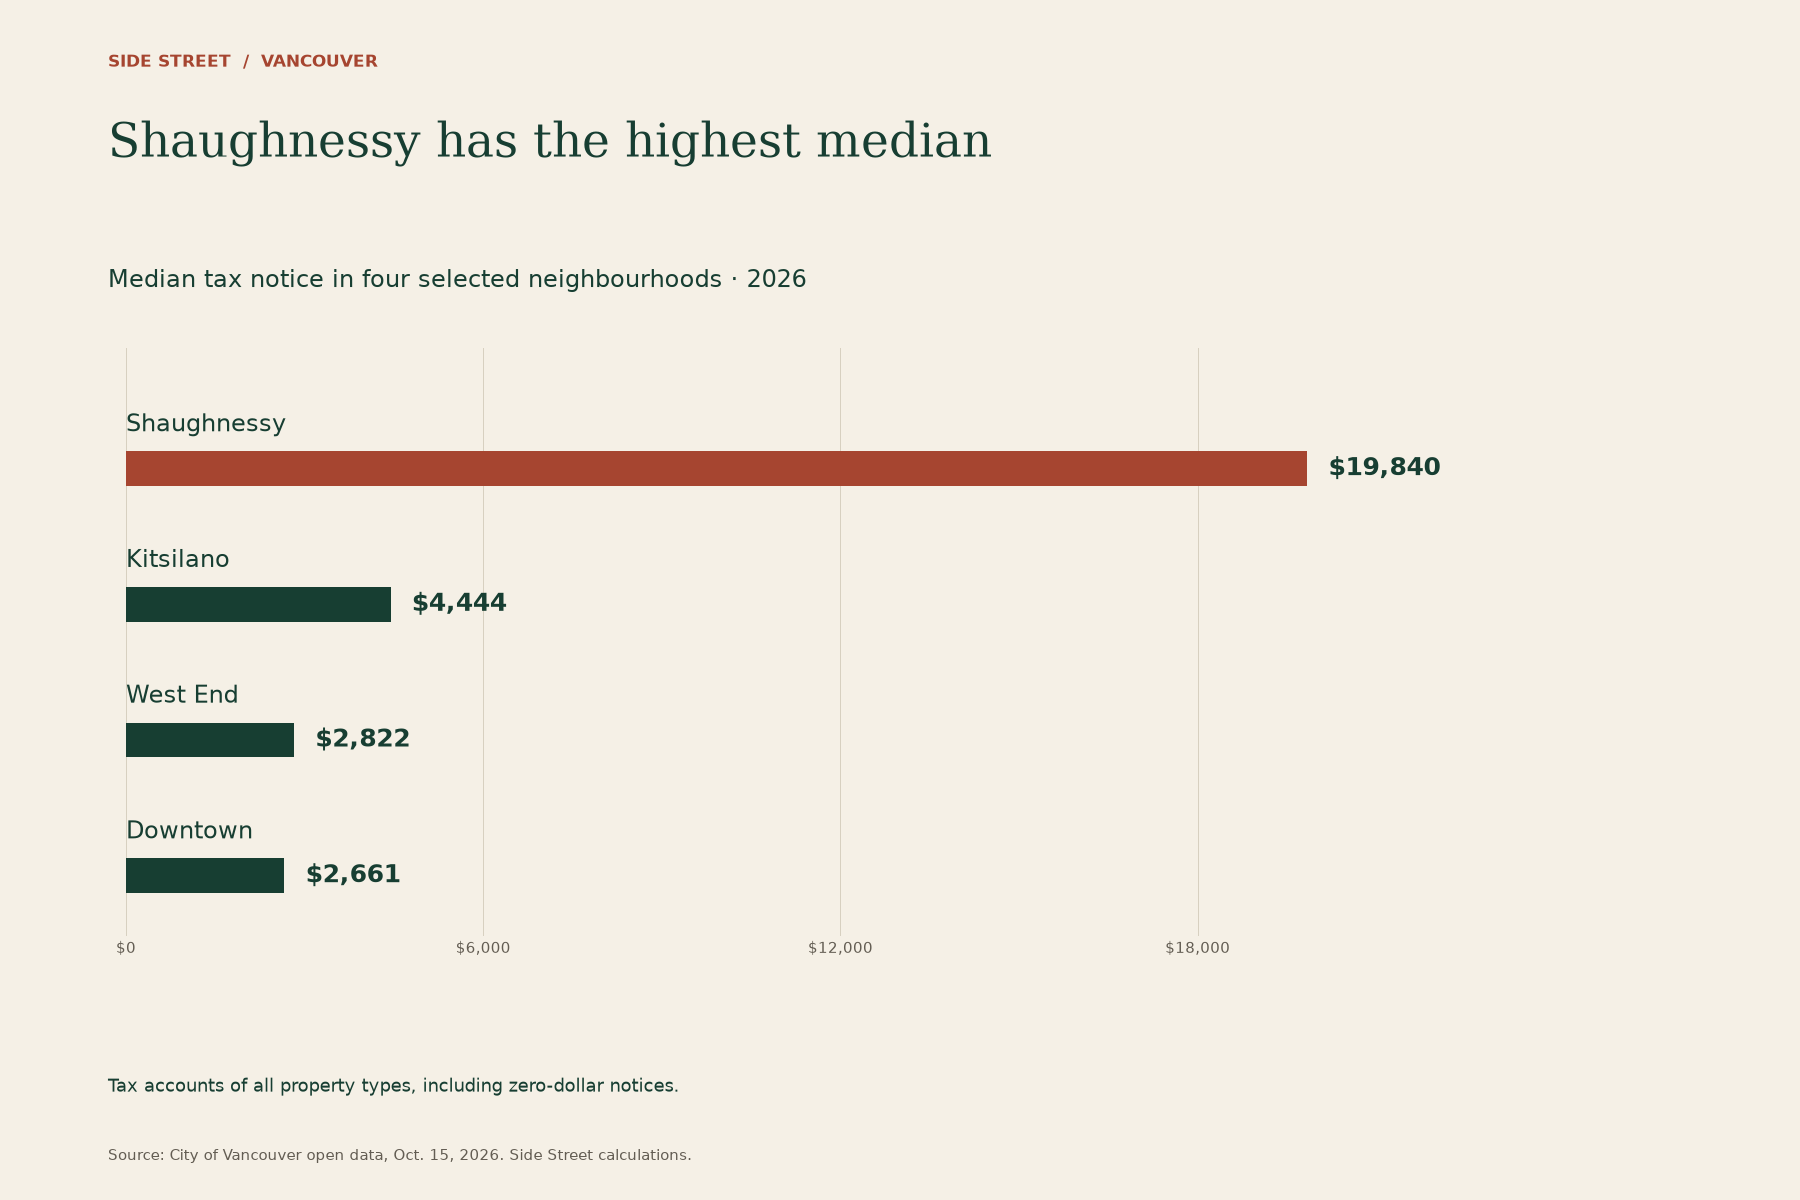
Downtown’s published property-tax bills add up to $467.5 million. That is more than three times Kitsilano’s total. Yet the middle notice Downtown is $2,661, compared with $19,840 in Shaughnessy.
Vancouver’s expensive houses get plenty of attention. The tax map gives us a reason to pay more attention to its apartment neighbourhoods, and to the amount of homes and business space they fit into a small part of the city.
Downtown accounts for almost a fifth of the mapped 2026 tax bills on just 3.9% of the land within Vancouver’s neighbourhood boundaries.
The totals cover full tax notices, including Vancouver’s share, other taxing authorities and utility charges.
Downtown combines many properties with higher business tax rates
Start with the number of accounts. Downtown has 43,136 in our comparison, against 2,833 in Shaughnessy, within neighbourhood boundaries of roughly similar size. That works out to about 92 accounts per hectare Downtown and six in Shaughnessy. These range from individual strata homes to whole rental buildings and commercial properties.
Then there are the offices, shops and hotels. Those generally pay business property-tax rates, which are substantially higher than residential rates.
At the same taxable value, business-class property faces about 3.67 times the municipal general-purpose tax in 2026. On $1 million of taxable value, the standard rates work out to:
| Property class | Municipal general-purpose levy on $1 million of taxable value |
|---|---|
| Residential | $1,934.06 |
| Business and other | $7,094.36 |
City of Vancouver, 2026 municipal general-purpose rates, before relief.
That combination helps explain Downtown’s lead. Many homes, substantial commercial property and higher business rates all contribute to the total. A neighbourhood can have a modest middle bill and still add up to a great deal.
Kitsilano comes second in total dollars, at $140.6 million, followed by the West End at $132.2 million.
Shaughnessy has large individual bills, but less per hectare
Shaughnessy’s large lots and landscaped grounds take up a great deal of land. A valuable house on a large lot can generate a substantial bill while spreading that bill over much more land than a building with many separately taxed apartments.
The West End makes the contrast clear. It has about $586,000 in published notices per hectare, compared with $158,000 in Shaughnessy. That is about 3.7 times as much per hectare, even though its median notice is only $2,822, against Shaughnessy’s $19,840. The West End generates nearly twice the total billed amount within roughly half the area.
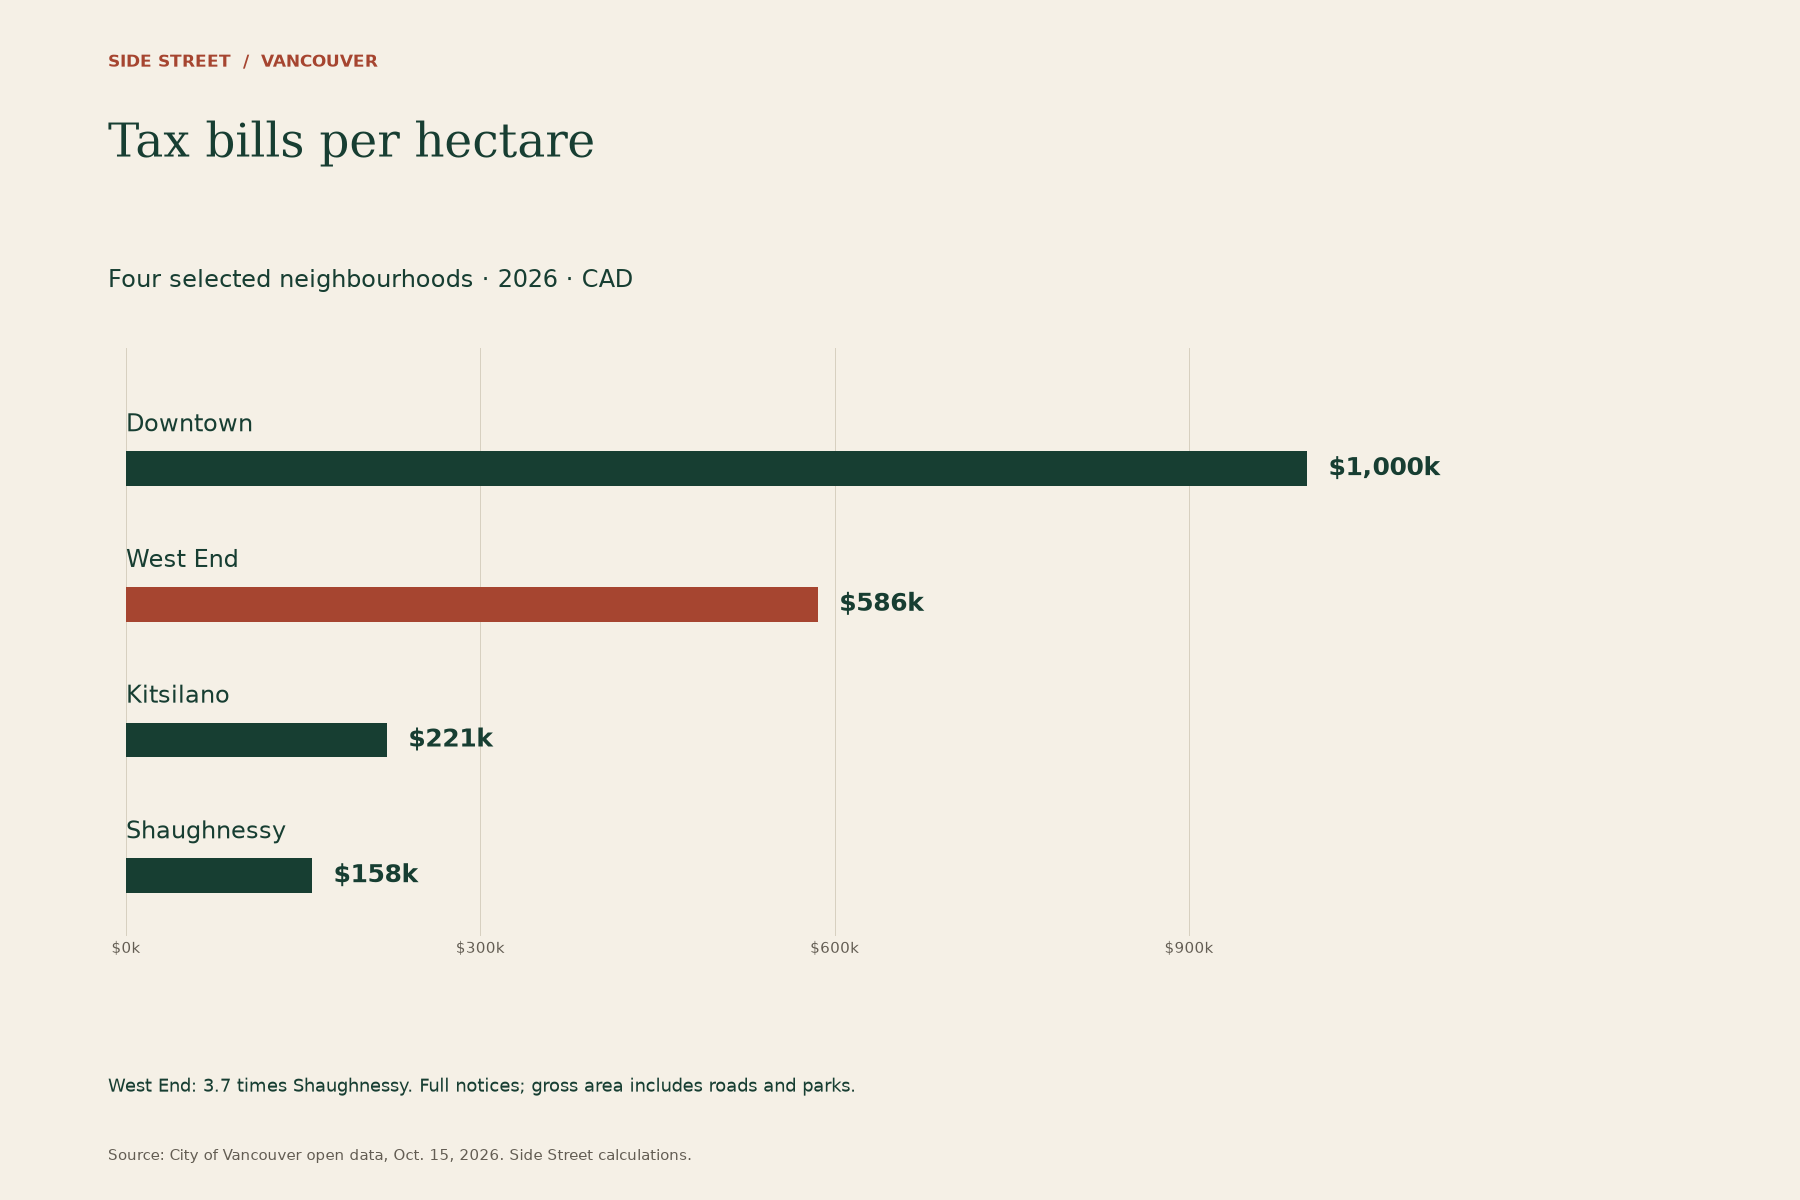
Shaughnessy’s $70.7 million total ranks 17th of 22 local areas, and it ranks 12th per hectare, with the highest values ranked first. Its median notice is the highest in the city. There are substantial bills here, spread across substantial pieces of land.
For us, the West End is the more interesting model. Its apartment buildings let many more homes share a neighbourhood, and the bills add up. That contribution deserves more attention in a city so accustomed to treating large detached properties as the desirable default.
Here are four neighbourhoods side by side:
| Neighbourhood | Full notices, total | Per hectare | Median notice |
|---|---|---|---|
| Downtown | $467.5 million | $1,000,066 | $2,661 |
| West End | $132.2 million | $585,824 | $2,822 |
| Kitsilano | $140.6 million | $221,013 | $4,444 |
| Shaughnessy | $70.7 million | $157,694 | $19,840 |
The middle bill is smaller Downtown
The median Downtown notice is about one-seventh of Shaughnessy’s. With individual strata units sitting alongside whole buildings and business properties, the mix of accounts explains why the middle bill can be small even where the total is enormous.
Apartments deserve more credit
We think this should change how Vancouver talks about density. The conversation often starts with what new neighbours will need: a school place, a bus, a patch of park. The tax map gives us another part of the picture. Places with room for many homes and businesses also account for substantial tax bills.
The West End’s $132.2 million is a useful figure to have in mind the next time apartments are treated mainly as a burden on an established neighbourhood. We should be more willing to welcome the people and businesses those buildings can accommodate.
Large lots are a choice about how much of Vancouver gets to be shared. We would like more room for apartments and shops in places where an expensive detached house is still treated as the obvious use of an entire lot.
Explore the neighbourhood map and comparisons.
Vancouver election guide · Try the Vancouver election compass · Standards and corrections
